Global warming is causing ice sheets and glaciers to melt around the world, but it can be hard to quantify how fast. Observations from land only take you so far.
That’s where satellite data comes in. With the assistance of a number of advanced spacecrafts, various parameters can be observed – from the length or altitudinal range of glaciers to snow cover and ice stream velocity – and these help to further our understanding of the cryosphere, the part of the Earth covered in snow and ice.
While our understanding of global ice change grows, the ice itself dwindles.
“Fortunately we’ve developed really powerful tools over the past 20 or 30 years to be able to track these changes, and that’s a good news story, but when we look at the signal it’s bad news,” explains Andrew Shepherd, Professor of Earth Observation at the University of Leeds and co-lead of the Ice Sheet Mass Balance Inter-Comparison Exercise (IMBIE), an international collaboration supported by the European Space Agency (ESA) and the National Aeronautics and Space Administration (NASA).
“That’s because every corner of our planet is melting,” he added, “whether that’s the ice that’s frozen in the oceans in Antarctica and the Arctic, the glaciers in mountainous regions, or the polar ice sheets of Greenland, they’re all unfortunately losing ice and ending up in the sea.”
A recent study, co-authored by Shepherd and published in peer-reviewed journal The Cryosphere, revealed that since the 1990s, the rate of ice loss has risen by 57% from 0.8 to 1.2 trillion tonnes per year.
That’s equivalent to a thousand times London’s annual water consumption or an ice cube 10km high – and it’s increasing.

Sea ice extent and thickness change over three decades for the Southern Hemisphere (a) and the Northern Hemisphere (b) in February and September of each decade, respectively.
It spells danger for coastal communities around the world, many thousands of miles away from where ice is melting the most. In fact, due to the way ice interacts with gravity, sea level acts in a counterintuitive manner.
As ice sheets possess a lot of mass, the gravitational pull around them is strong, forcing relative sea-level nearby to be high. When ice melts, the water surrounding the mass drops, encouraging a rise elsewhere in far field sites, sometimes on the other side of the globe. Greenland melt, for example, is predicted to correspond with sea level rise in the Southern Hemisphere.
In a vicious cycle, when ice thaws the area gets darker and reflects less of the sun’s energy back out to space, causing further warming. Salinity, ocean circulation and atmospheric patterns are also affected.
“It’s really critical to separate out the effects of weather from climate, and that’s across the whole global climate system, but for the cryosphere it’s particularly important, as things can happen really quickly,” said Shepherd. “We’ll have a heavy snowfall one winter or a rapid melt one summer, and we need to be sure that that’s a climate signal and not just a short term effect.”
IMBIE and the ESA’s Climate Change Initiative has been using long-term datasets to distinguish defined trends from seasonal noise spanning up to four decades, from 11 satellite missions. Among those is the CryoSat-2, a satellite orbiting 719km above Earth that can detect changes in thickness of all ice types.
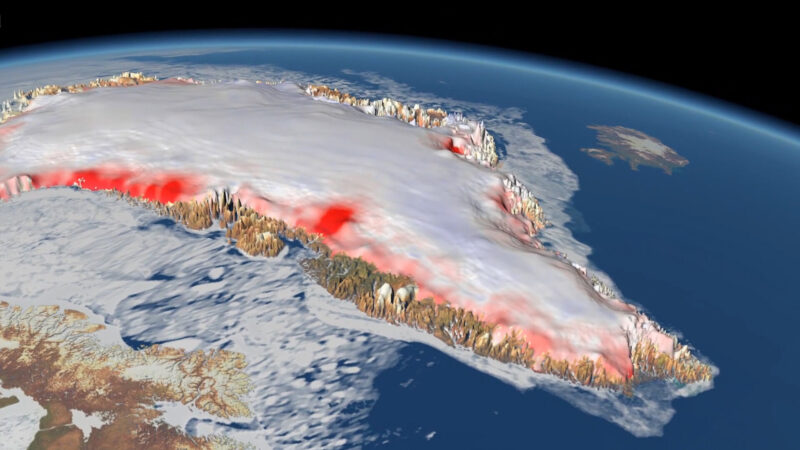
Data from these missions reveal that Greenland and Antarctica are seeing vastly increased rates of change, with the former losing ice mass seven times faster than in the 1990s. The 2020 Nature paper by members of IMBIE found that that melt between 1992 and 2018 was enough to push global sea level up by 10.6 millimetres.
Every centimetre of global sea level rise subjects another six million coastal inhabitants to flooding. On current trends, Greenland ice melt alone is expected to cause an additional 100 million people to be at risk of floods by the end of the century.

Global sea-level rise from Greenland ice melt according to the IMBIE study, tracking closely along with projections from the IPCC AR5 for 1992-2040 and 2040-2100.
The results closely align with the Intergovernmental Panel on Climate Change’s (IPCC) worst-case scenario outcome, the upper range of its sea-level predictions set out in its Fifth Assessment Report.
Data from satellite observations showed that the ice loss has largely been due to increased surface meltwater runoff and increased glacier flow, encouraged by climate change-related increases in air and water temperature respectively.
“We think the most powerful tool we can have now is satellites in space and models on the ground. We can track Earth’s climate trajectories into the future and hopefully be able to tell people we’re trending towards a good news story as we reduce emissions – we should be able to see the ice sheets recover,” says Shepherd.
The IMBIE team is now providing updates on an annual basis to the scientific community and policymakers and has recently contributed data to Climate Change 2021: The Physical Science Basis, the first part of the IPCC’s Sixth Assessment Report.
Andrew Shepherd discusses how long-term satellite observations can help cryospheric scientists understand and monitor changes in Earth’s ice here.
Visit ESA’s Climate from Space app to explore global satellite records that span five decades and form a major contribution to the scientific evidence that underpins current understanding and future prediction of the changing climate.
This post was sponsored by the European Space Agency. See our editorial guidelines for what this means.